Recovery Test Analysis
"The support for AQTESOLV is unparalleled."
--Harm Maathuis, Saskatchewan Research Council
AQTESOLV provides more features and solution methods for the interpretation of recovery tests than any competing software!
You may use any pumping test or constant-head test solution in AQTESOLV to analyze recovery tests in confined, leaky confined, unconfined and fractured aquifers.
- analyze drawdown and recovery together
- apply the powerful Agarwal transformation to analyze recovery data like drawdowns
- analyze residual drawdowns
Combined Drawdown/Recovery Analysis
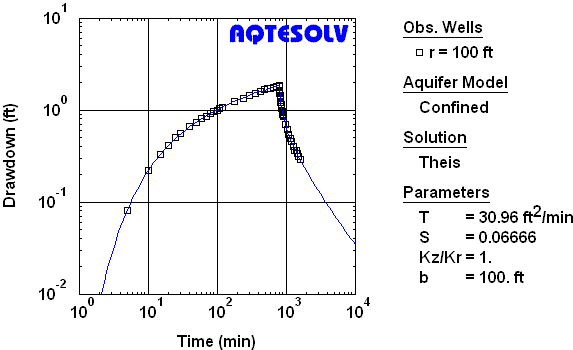
With AQTESOLV, you may combine the analysis of drawdown and recovery data to provide a consistent estimate of aquifer properties from the complete set of test data (Figure 1).

Use this recovery test method with any of the type curve solutions for pumping test analysis in AQTESOLV.
Agarwal Method
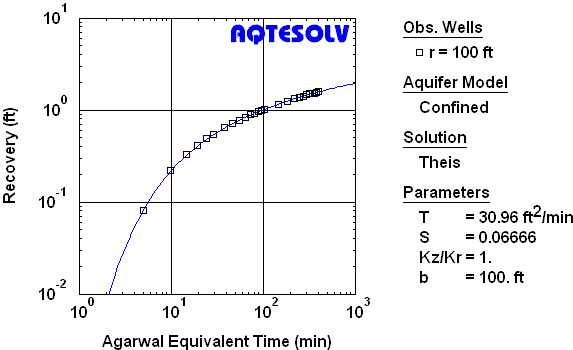
AQTESOLV features the powerful Agarwal method for the analysis of recovery test data (Figure 2).

Through a simple transformation of field data, Agarwal (1980) devised a method of recovery test analysis that allows one to use the same type curves developed for the analysis of drawdown data.
AQTESOLV also allows you to perform derivative analysis with the Agarwal recovery method.
Residual Drawdown Analysis
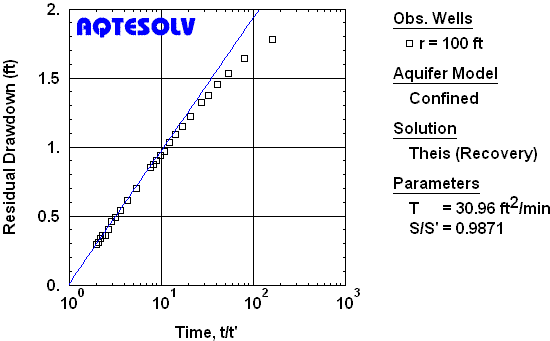
AQTESOLV includes traditional residual drawdown plots (Figure 3) that you may use to analyze recovery data. A residual drawdown plot displays s' versus t/t' where s' is residual drawdown, t is time since pumping began and t' is time since pumping stopped.

In groundwater hydrology, one commonly uses a residual drawdown plot with the Theis (1935) residual drawdown solution; however, with AQTESOLV, you may use any type-curve solution to analyze recovery data on a residual drawdown plot.
See also: recovery tests, Agarwal method