Aquifer Tests
by Glenn M. Duffield, President, HydroSOLVE, Inc.
What Is An
Aquifer Test?
An aquifer test is a controlled field experiment used to estimate hydraulic properties of aquifer systems such as transmissivity, hydraulic conductivity and storativity (storage coefficient). The three fundamental aquifer testing methods are pumping tests, slug tests and constant-head tests. Each method differs according to the type of hydraulic stress that a control well imposes on the aquifer system under investigation.
Methods Of
Aquifer Testing
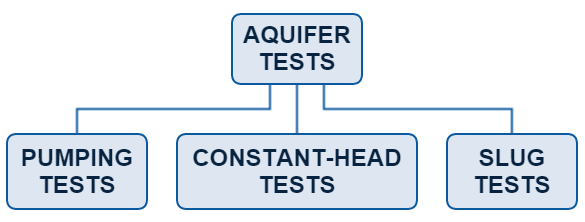
Three aquifer testing methods are in common use by groundwater hydrologists to estimate hydraulic properties of aquifer systems. In all of the methods, a control well imposes a hydraulic stress on an aquifer system. The methods differ according to the type of hydraulic stress:
- In a pumping test, a pumping well stresses an aquifer by extracting or injecting water at a controlled rate.
- In a slug test, the imposed hydraulic stress is due to a sudden change in water level in the control well.
- In a constant-head test, the head or drawdown in the control well is not allowed to vary.
Since the 1930s, aquifer system properties have been estimated from aquifer tests by fitting mathematical models (type curves) to response data (water-level changes or pumping rates) using a procedure known as curve matching. Traditionally, curve matching has been performed using various graphical procedures; more recently, automated curve-matching methods involving nonlinear least-squares techniques have come to the fore. Modern evaluation of aquifer test data has augmented graphical and automatic curve-matching techniques with derivative analysis for more thorough and robust data interpretation.
Pumping Tests
A pumping test stresses an aquifer by pumping a test well at a controlled rate while water levels are measured in one or more surrounding wells. A constant-rate test is the most commonly performed pumping test; however, variable-rate pumping tests such as step-drawdown tests for assessing well performance or designing a constant-rate test are sometimes carried out as well. Pumping tests are conducted to estimate the hydraulic properties of aquifer systems as well as identify aquifer boundaries.
Among groundwater hydrologists, the most familiar curve matching procedure for estimating aquifer properties from pumping tests is due to Theis (1935). The Theis method allows one to estimate the transmissivity and storativity of a nonleaky confined aquifer having infinite extent by means of matching the Theis type curve to water-level changes (drawdowns) measured in wells during a constant-rate pumping test (Figure 3).
Publication of the work by Theis (1935) marked a major stride forward in groundwater science because of the mathematical rigor applied to the evaluation of transient (nonequilibrium) pumping test data. In the decades since Theis' seminal work, a great number of progressively more sophisticated models have appeared in the literature that further facilitate the interpretation of pumping tests for different well configurations and aquifer geometries. For example, Hantush and Jacob (1955) published the first transient solution for the interpretation of pumping tests in leaky confined aquifers (Figure 4).
Slug Tests
Slug tests, another common aquifer testing technique, are conducted to obtain estimates of aquifer/aquitard properties at a smaller scale than pumping tests. A slug test is initiated by causing the water level in the control well to suddenly rise or fall and subsequently recording the recovery of the water level to its pre-test level. In addition to estimating hydraulic properties, slug tests are sometimes performed to provide an indicator of well performance. These relatively inexpensive tests, which involve little or no water added to or removed from a well, can be advantageous at groundwater contamination sites.
Beginning in the late 1960s, rigorous mathematical models became available for the analysis of slug tests including the KGS Model by Hyder et al. (1994) (Figure 6).
Constant-Head Tests
In practice, constant-head tests are performed less frequently than either pumping tests or slug tests. In a constant-head test, the head or drawdown in a control well is maintained at a constant level and the declining discharge rate from the control well is recorded with time; in addition, water level changes may be measured in surrounding wells.
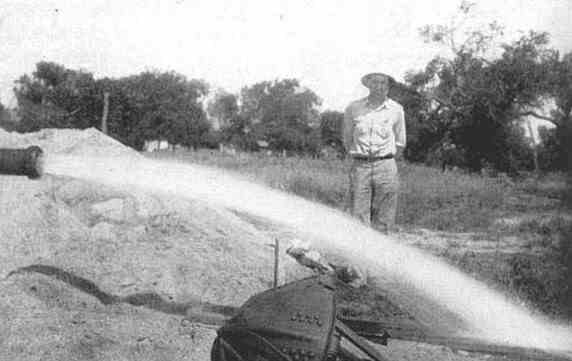
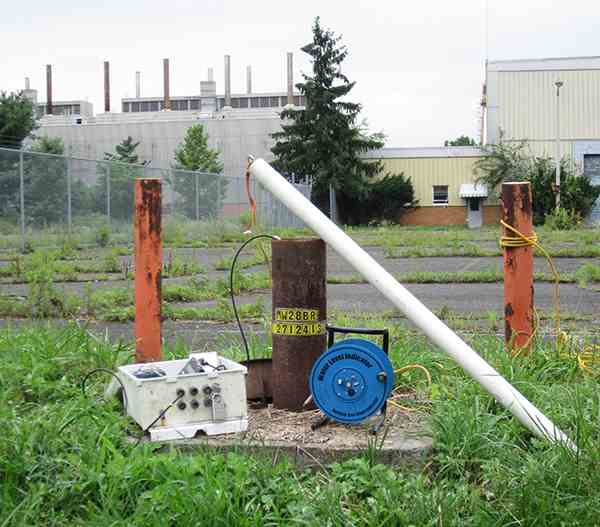
One particular application for a constant-head test is a flowing artesian well in which groundwater under confined or artesian pressure flows at the land surface (Figure 7). In the literature, one finds constant-head tests were performed on flowing artesian wells in the Grand Junction area, Colorado, USA, to estimate the transmissivity and storativity of a confined aquifer (Lohman 1965).
The first analytical solution in the groundwater literature for the interpretation of a constant-head test in a nonleaky confined aquifer is due to Jacob and Lohman (1952). Using this solution, one matches type curves to transient discharge data measured at the control well to estimate transmissivity and storativity (Figure 8).
Additional
Resources
Aquifer Testing References
Looking for literature relating to aquifer tests? Review the annotated aquifer testing reference list to find publications and articles pertaining to pumping tests, slug tests, constant-head tests and more.
Aquifer Testing Glossary
Please visit the glossary for a list of aquifer testing terms and their definitions.
Calculators
Check out the online calculators for computing the Theis well function, converting specific capacity to transmissivity, estimating radius of influence and more.
Learn More
Learn more about aquifer testing methods, aquifer properties and more.